EpiEvident
Biosurveillance Proof of Concept App for Case Count Monitoring
| Summary | Duration & Location | Role |
| Biosurveillance analysts collected raw data (disease case counts and news articles) from multiple sources in order to monitor diseases globally. EpiEvident was a proof of concept application designed to improve the efficiency of the surveillance process by programmatically collecting the required standardized global disease case count data from different sources and visualizing it to support different analytical tasks. | 10 weeks from June 2017 - Aug 2017 at Data Science & Analytics group in Pacific Northwest National Lab, Richland WA. | I was the UX person and worked with 3 other interns - 2 developers and 1 epidemiological statistician. All teams including ours were mentored by a Research Data Scientist, Software Engineer and UX Designer |
| UX methods used | ||
| User interviews Stakeholder/ subject matter expert interviews Analytical task analysis Wireframes User interface design (Material) Visualizations design (adapted Tamara Munzner’s visualization design framework ) High fidelity interactive prototyping (HTML, SCSS) |
Key Responsibilities
As the solo UX member, I led and executed-
- Understanding and communication user needs and goals through user interviews, personas and task analysis
- Creating and testing different user interface and visualization design options against desired user performance goals (learnability and usability) and development goals (technical feasibility and time constraints)
As a team member, I assisted my teammates with-
- Coding the UI using HTML, SCSS, Reactvis and repository management
- Creating presentation materials such as video, user manual etc.
Project Requirements & Methodology
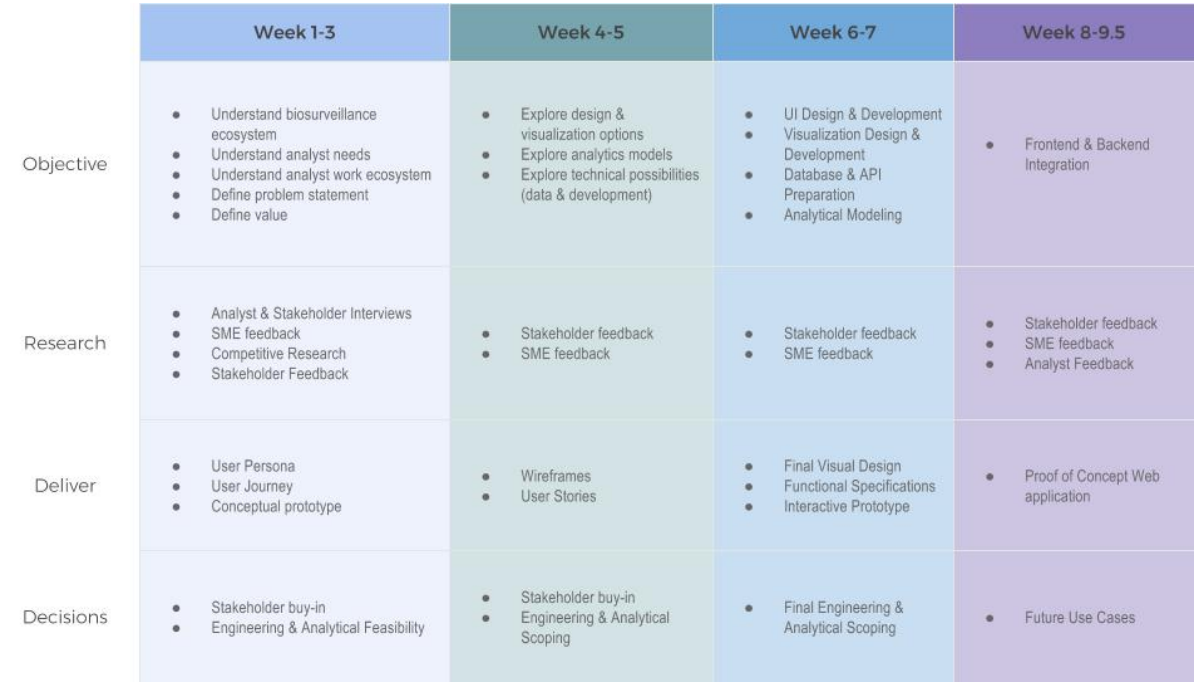
Over the 10 weeks, our team understood the users (analysts) and their ecosystem, defined their analytical needs, ideated potential designs and prototyped an interactive proof of concept. At different stages of the project, we sought feedback from domain experts, designers, engineers and analysts. Below is a neat timeline summarizing our design and development process. It also highlights the research methods, deliverables and the objectives of the different stages of the project.
Research and Problem Definition
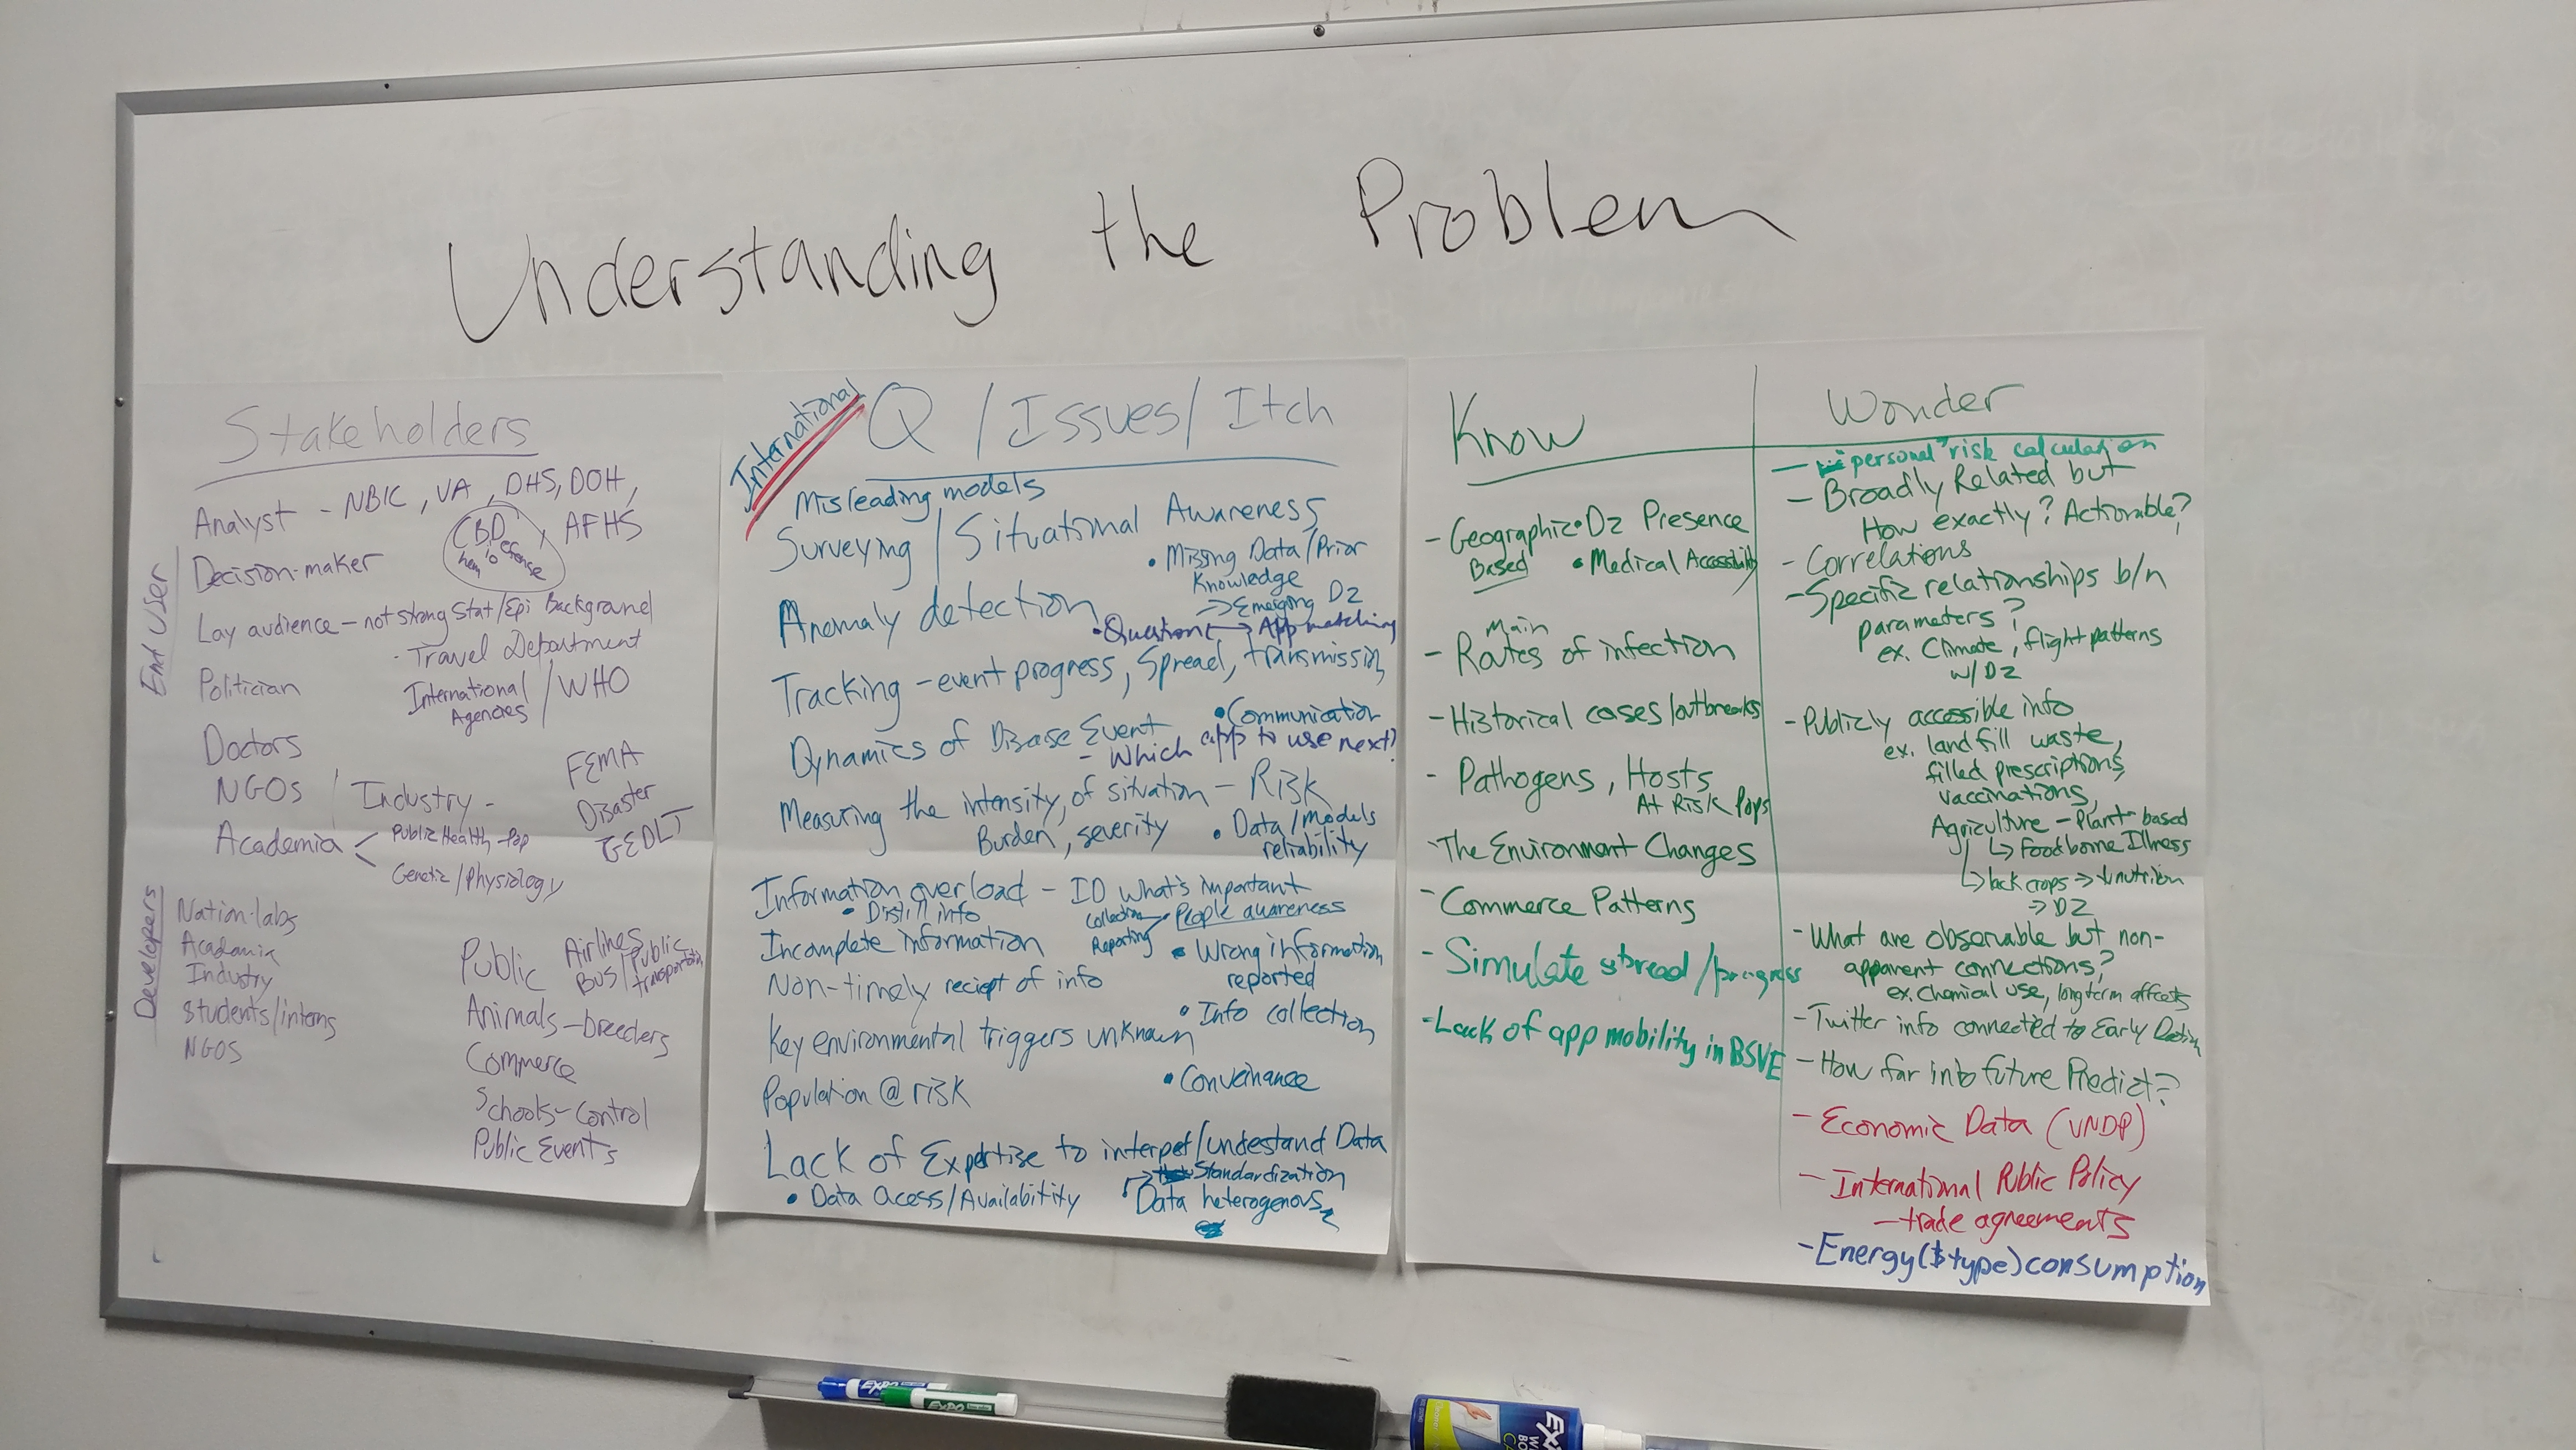
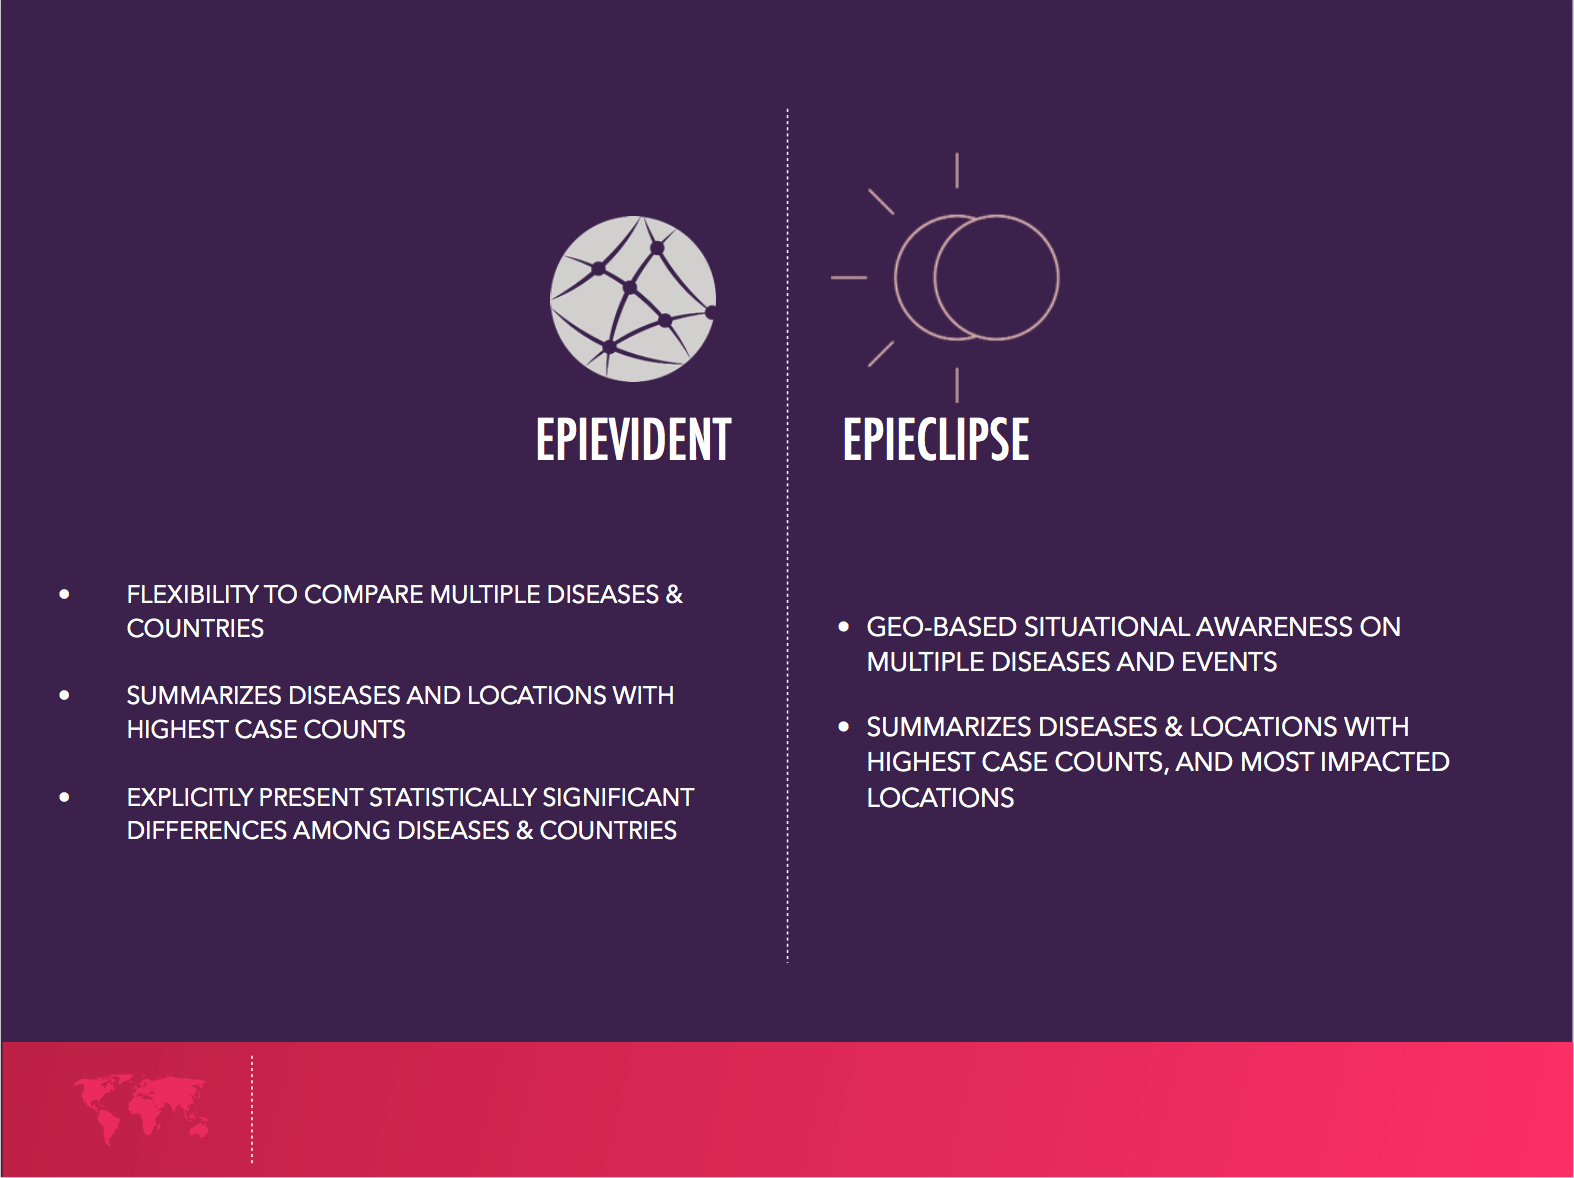
Based on analyst interviews, we identified our primary users, their goals and needs and presented 2 app concepts- EpiEvident & EpiEclipse- to stakeholders to get their feedback on which they liked better. Based on their feedback, we went ahead with EpiEvident.
User Interface and Visualization Design
We explored several visualization options such as- Scatterplot View, Geo View & Matrix view.
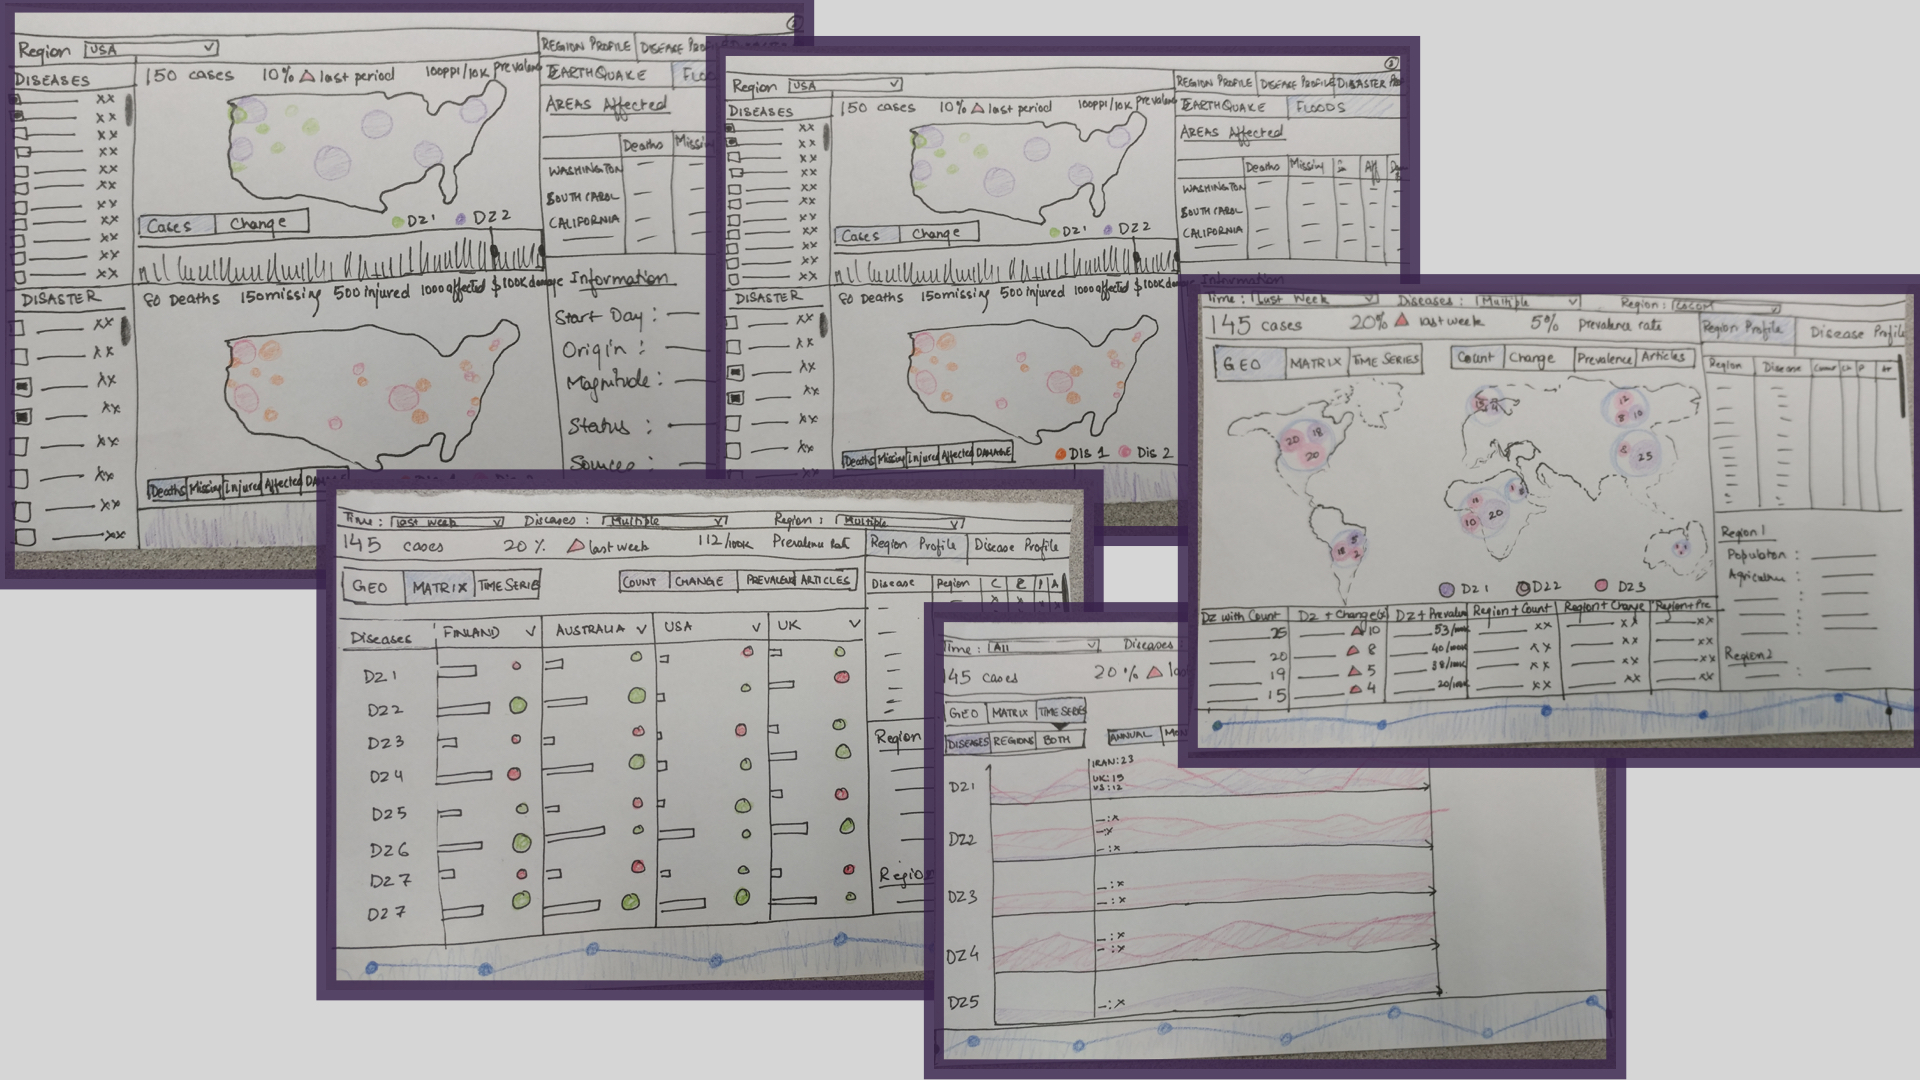
However, through multiple discussions with visualization and design experts, we decided to proceed with a combination of matrix view and a line chart.
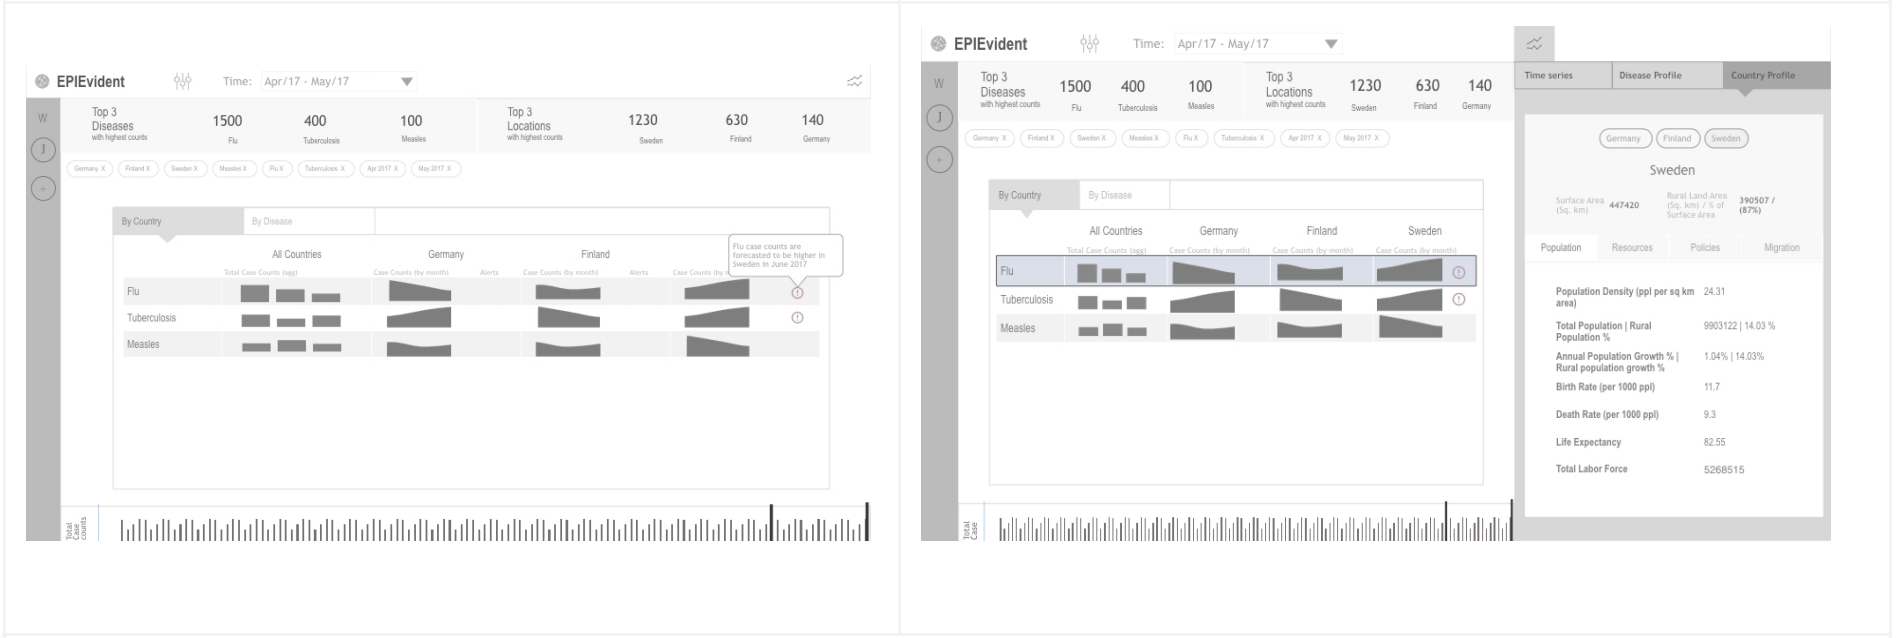
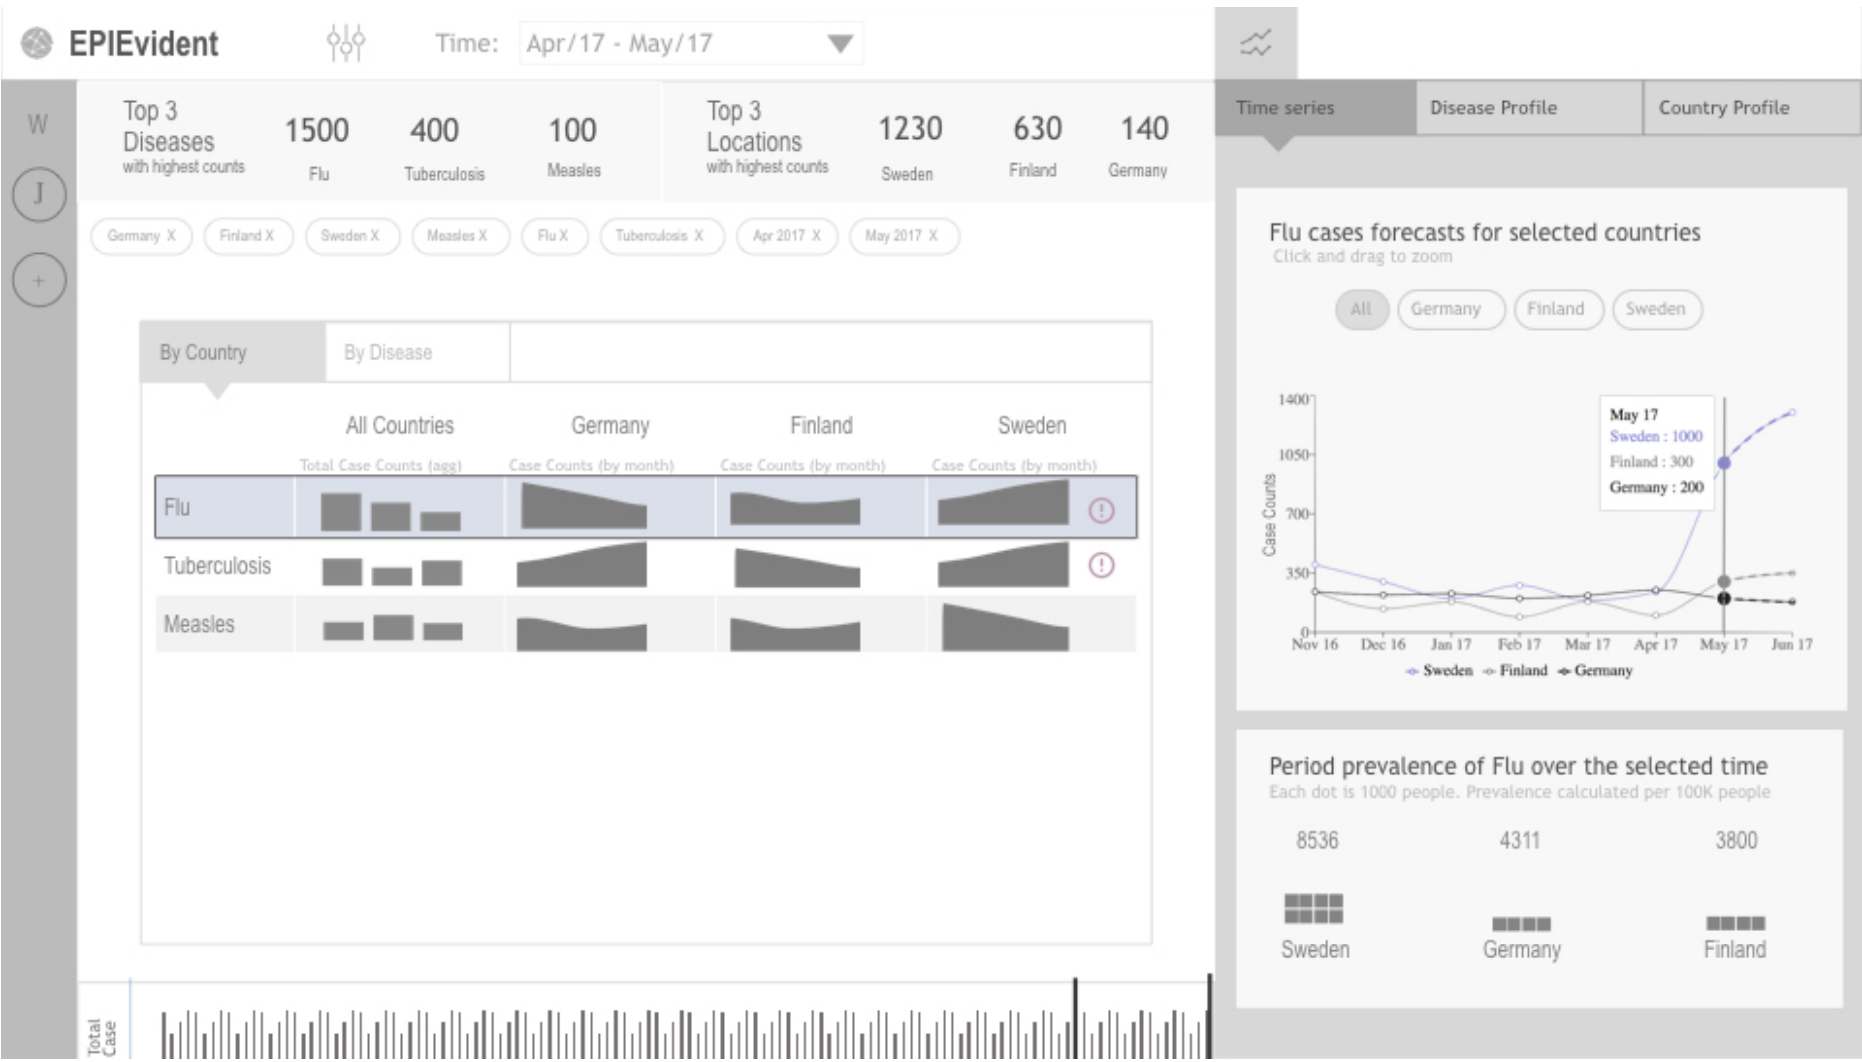
Overall, the web application was well received by the analysts and the stakeholders. They found the user interface intuitive and straightforward. They also liked the collaborative aspects of the application. For future work, they suggested that generalizing the use case to different levels of specificity would further increase its utility.
References
2018
- Epi Evident: Biosurveillance to Monitor, Compare, and Forecast Disease Case CountsOnline Journal of Public Health Informatics, 2018